Wind turbines. Windmills. I understand they look similar, but we are too far on to be mistakenly calling wind turbines windmills. It’s a pet peeve of mine; forgivable in casual conversation but I have seen news outlets get it wrong.
In this article, I will answer an extremely pointless question: If a modern wind turbine really was a windmill, how much flour would it produce? How many modern windmills would it take to feed the UK?? Forget Watts, let’s talk flour power!
Foreword
This is a back-of-the-envelope calculation, please do not take it any more seriously than that. As you will see, I will be using very limited and highly caveated information about windmills, publicly available data elsewhere, and occasionally some numbers plucked from “engineering judgement”.
The comparison
The windmills of the UK are almost all extinct, only a few still exist today and even fewer are capable of producing any flour. To cut a long and interesting history of windmills short, technological advancements like electricity and the combustion engine made them uneconomical. As such, for the windmill model I will use one from the 1800’s. Specifically, I will be using Union Mill, which is situated in Cranbrook, Kent (England).
As for the modern wind turbine (WT), I will use the DTU 10MW reference turbine and situate it somewhere in the North Sea. This is a fictional turbine created for research purposes. You could debate both ways if this is representative of a modern WT. Concerning location, almost all of the action is happening offshore, and for the UK most of it is happening in the North Sea. As for capacity, for an offshore wind farm installing their turbines today, 8-10MW is pretty common. Given that the largest turbines being developed right now are pushing 15MW, the DTU 10MW could be considered small.
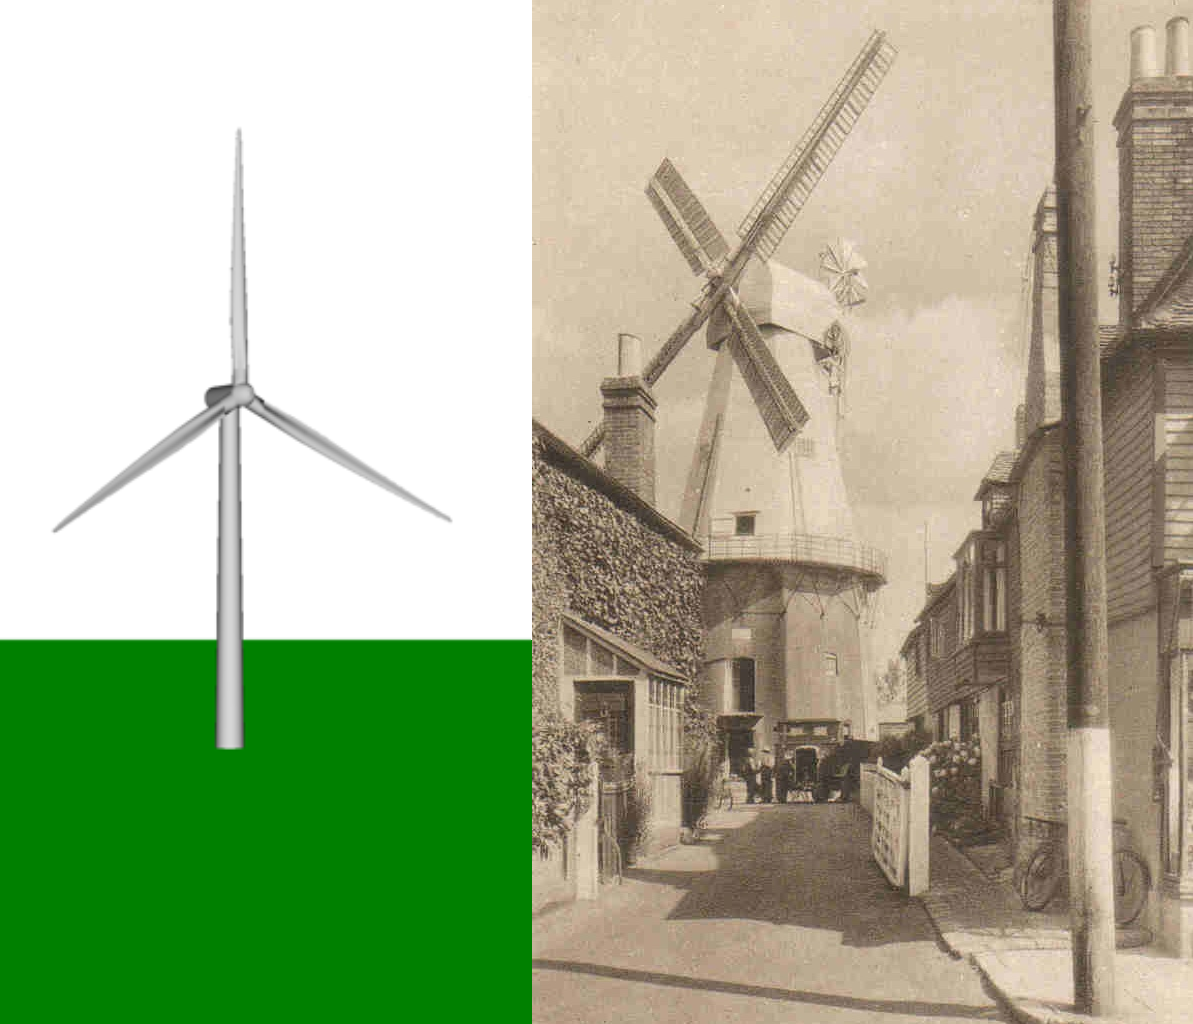
Left, the fictional DTU 10MW reference turbine, image reference [1]. Right, Union Mill circa 1930s, image reference [2].
On the milling of flour, I am not going to question how exactly the conversion from generator to mill stones is going to work. For arguments sake, let’s just say the electricity from the turbine powers a motor that turns multiple set ups exactly like Union Mill with 100% conversion efficiency. If someone wants to submit a different proposal, then go ahead. Perhaps a vertical axis WT is a better starting point?
Calculation 1 - Swept Area
As a simple first calculation, we will scale up the swept area of Union Mill (UM) to match that of DTU-10MW. Swept area is simply the size of the disk that a blade sweeps through when it does a full revolution of a WT/windmill. We can then scale up the capacity to match.
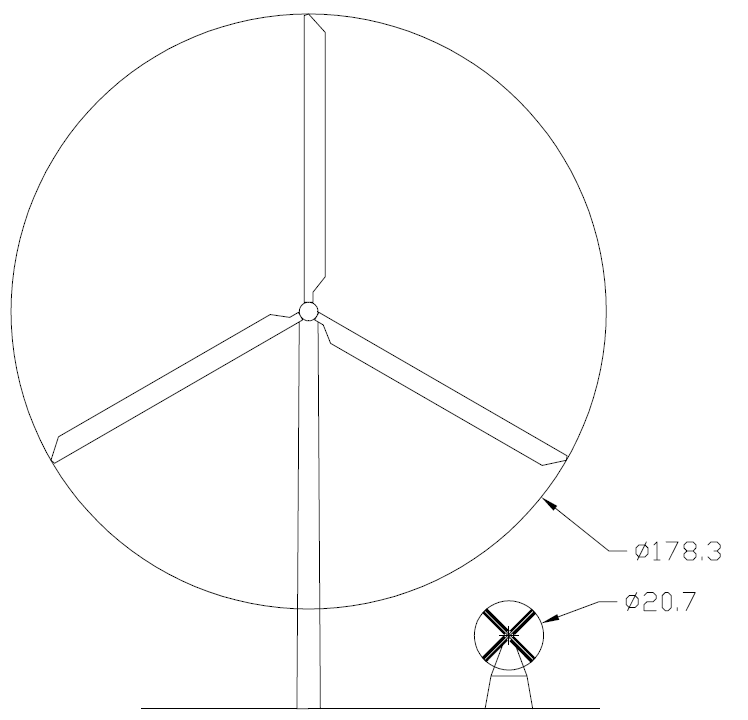
Diameters of the machines' swept areas. Dimensions in meters.
As per the figure above, UM has a rotor diameter of 20.7m [3] giving it a swept area of 337.5m2. Meanwhile, DTU-10MW has a rotor diameter of 178.3m [4], therefore a swept area of 24,967.8m2. That is 74 times larger!
I got in touch with the folk at Union Mill were and they were kind enough to provide an estimate for flour production. The value of 50kg/hr was given with the caveat that this was “lucky to achieve [...] in favourable conditions”. I have interpreted this value as the windmill’s rated capacity. Scaling 50kg/hr up, the DTU-10MW would have a capacity of 3,700kg/hr. That’s almost exactly a kilogram, or 2 loaves of bread, per second.
Calculation 2 - Energy Yield
Capacity is one way to compare the machines, another is energy yield or, in this case, flour yield. For this, we will consider wind speed data, wind profiles at each site, and power curves.
Wind profile is the way in which the average wind speed changes with height above ground. If you have a measurement at a known height, you can extrapolate wind speed for any height using the logarithmic wind profile [5] and estimates for roughness of the surrounding area (note i).
A year’s worth of hourly wind speed data was generated by MEERA2 for both sites [6]. This was for a height of 50m above ground. The coordinates of Union Mill are {51.0951, 0.5392} which put it literally in Cranbrook. As for DTU-10MW, a North Sea location of {54.7488, 1.2048} was used.
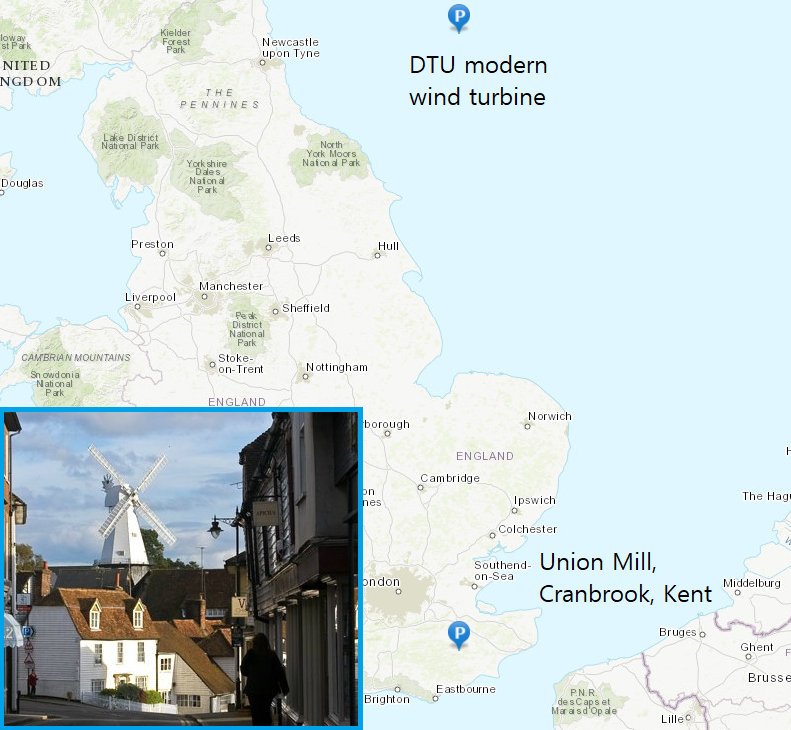
Map image reference [6]. Union Mill image reference [7].
The location of UM in the middle of a town means blockage and roughness is about as extreme as it gets. Whilst this makes for poor wind quality, the location was probably a necessity. It would reduce the distance buyers needed to travel, quite an important point when cars were yet to be invented. On the other hand, a WT today is placed where the wind regime is good and where public opposition is likely to be low. This typically means offshore.
From the above values, we can extrapolate wind profiles for each site.
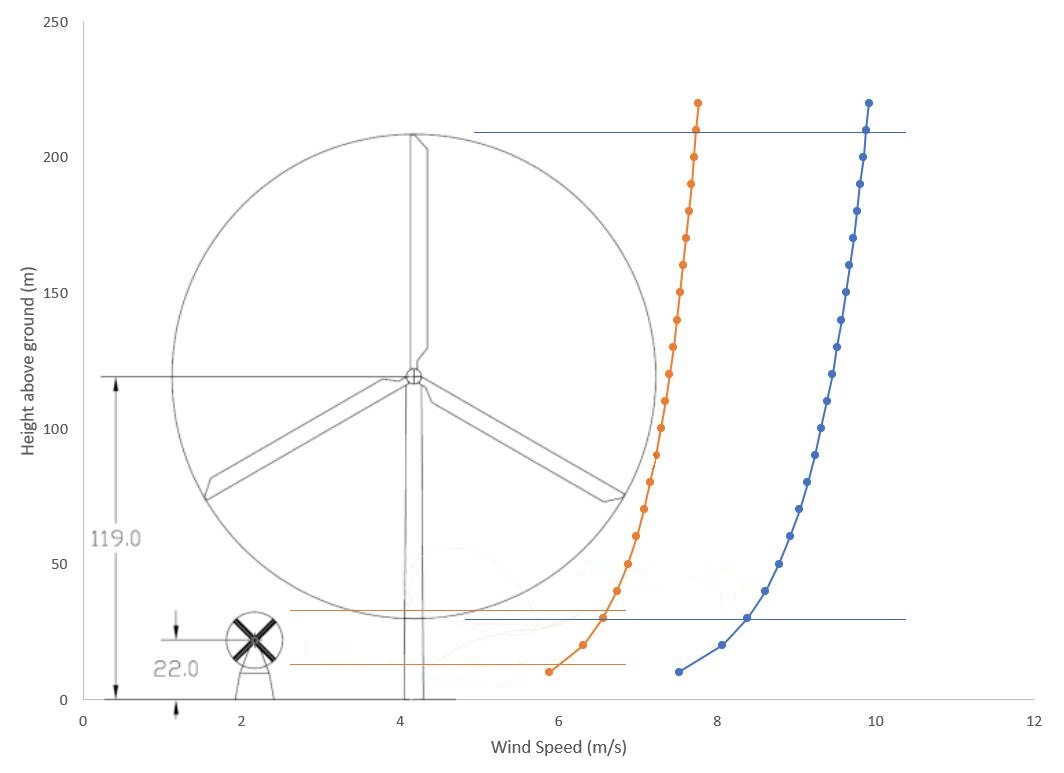
Wind profiles relative to WT/UM heights.
Two observations can be made from the above: (1) wind speed increases with height, and (2) the offshore wind regime is significantly stronger. This compounds power when using larger turbines; not only do you have greater swept area, but you also have better average wind speeds across that area.
Power curves
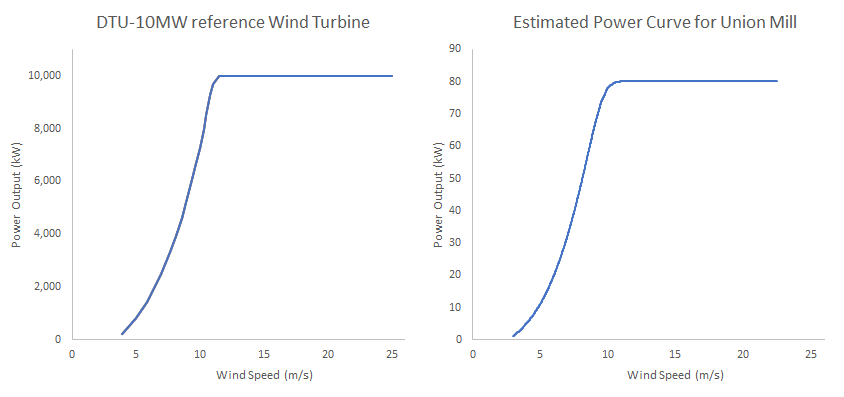
Power curves specify the power output of a WT for a given wind speed. For DTU-10MW, this has been provided [1]. For UM, a bit of judgement is needed. Firstly, note that UM does have the ability to yaw, as well as speed regulation. This is done via shutters along the blades. As such, I have optimistically assumed its “power curve” to be of the same shape as a normal WT. Given the poor wind resource, I am also going to assume an IEC 3 wind class (see [8] for info on wind classes). Next, I scaled down the power curve of the “Generic 3.45 MW - IEC Class 3” [9]. I did this by reducing power output by the same factor as swept area was reduced. For reference later, this equates 50kg/hr to 80.2kW. The power curves (in kw) are as follows:
With the wind profiles, hourly wind data, and power curves in hand we can now calculate energy yield.
For each hour in the year’s worth of data, the average wind speed at hub height (ii) was used to calculate the energy yield for that hour (iii). I then multiplied this by 0.95 to account for times of the year the WT/WM are likely unavailable. An general efficiency of 0.90 was then applied.
Results
This calculation estimates DTU-10MW’s energy yield at 42,012.3 MWh and therefore a capacity factor of 0.48 (iv). For UM, it is 195.8MWh and a CF of 0.28. In other words, the modern WT would produce about 215x more flour in a year than a windmill.
In flour terms, using our conversion rate of 50kg:80.2kWh, this means DTU-10MW would produce 26,200 tonnes in a year!
The obvious question which follows is: How many DTU-10MWs would it take to feed the UK? According to reference [10], we consume 5 million tonnes a year. Using this value, 191 WTs would be needed. Putting this back to energy would be 1.91GW so about 3 London Arrays, or about 2 Moray Easts.
Final (extra) Calculation
One final interesting nugget the folk at Union Mill gave me, UM would not have operated at night. I’ll give you a second to guess why that might be. ANSWER: there would be a risk of candles setting off a flour explosion!
Using approximate sunrise/sunset times and assuming the miller ate a lot of carrots, the new energy yield for UM was calculated to be 105.3MWh (CF of 0.15). Therefore, assuming the modern WT would use LEDs, it would produce about 400x more than a WM.
Discussion
Before discussing the merits of flour power, let’s get the most obvious point out of the way: a modern industrial mill is going to be a lot more efficient than an 1800’s stone-based windmill. According to a volunteer at UM, non-wind powered mills had existed well before UM was built in 1814 with the advent of the Industrial Revolution some decades earlier [11]. UM itself was hybridized with a steam engine in the 1860’s, with wind power “being limited to the time of the most favourable wind speeds”. Eventually, use of wind power “ceased for commercial milling around the 1940's”. All of this suggests the performance of wind power technology could not compete with the alternatives of steam, gas, and electricity. In this context, it is strange to confuse wind turbines with windmills: one has been massively advanced in recent years thanks to the need to combat the effects of the Industrial Revolution, the other was killed by it.
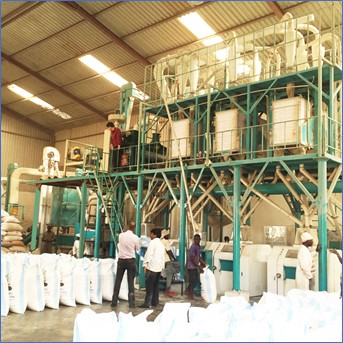
For a modern industrial mill production rate, a quick search takes you to Alibaba (see image below). There, some machine specs will tell you a 170kW machine can process 50 tonnes of wheat in 24hrs, with an “extraction rate” of 80%. This suggests the conversion of rate is 40 tonnes:4,080kWh. This is about 16x greater than the rate calculated for UM using wind power. So, a modern WM might produce more like 411,000 tonnes/year. Or >6,000x more production than a windmill. Or only 13 WTs to meet UK demand. But that is a boring calculation, and it cheats the question as well. When someone mistakes a WT for a windmill, it is not because they assumed the electrical power is supplying milling machines.
Are there advantages to flour power? Yes, this produces a dispatchable commodity as flour keeps for quite a few months. The operators would no longer need to worry about grid balancing and could produce every chance they get. You would also not be limited to sell the product back to one market and could quite easily ship it to an entirely different country depending on the selling price of flour. Another advantage might be the novelty factor/tourism. Say an onshore wind farm that was reasonably near a population centre converted just 1 of their WTs to a windmill. That would be worth a visit, right? Throw in a visitor centre, a shop which sells the flour, and cafe/bakery which uses it. That sounds like a good tourist attraction!
What about the challenges facing an offshore windmill farm? Transporting both the grain to the mills and the flour back is going to be difficult. Realistically, each WT would need huge silos to store the unprocessed, processed, and waste products. And each WT would need to be visited multiple times a month to drop off new feed and collect the flour before it goes off. This is how some oil rigs work. However, O&G economics might not work for a fleet of windmills. An alternative could be a pipeline, possibly with screw conveyors. Rather than convey everything to/from shore, perhaps we could run everything back to a substation that has been converted to be a warehouse. The problem with screw conveyors is that they only work over small stretches and consume quite a bit of power. But say you could get it back to the substation/warehouse, then, with an Industry 4.0 mindset, a fleet of autonomous grain tankers could transport everything to/from ports around the North Sea depending on prices, transport costs, weather predictions, and so on, i.e. LCoF (Levelized Cost of Flour).
Conclusion
A comparison of wind turbines and windmills has been performed, with multiple back-of-the-envelope calculations to compare flour production rates. Modern WTs are advantaged by size, stronger winds, and less interference from the surrounding area. This alone makes them around 400x more productive than traditional windmills. Additionally, they can take advantage of modern, efficient, electricity-fed flour mills which means far greater production than the stone mills of the 1800s. This means a modern WT could be Depending on which factors are included, a modern WT produces between 74-400x more than a typical windmill. And if modern milling machinery is included, this factor could be as high as 6,000.
Based on the above, a heuristic of 40 million kg flour/year/MW is recommended to convert WT capacity to windmill flour production. So, if someone mistakenly calls a 2MW wind turbine a windmill, you can say “wow, you really think that wind turbine produces 80 million kilograms of flour a year? Assuming a 20-year lifespan, that’s 1.6 billion kgs!” (v).
If you have thoughts on this calculation, comment and let me know what you would change. Or share your proposal for an offshore windmill farm. Or maybe share examples of misnamings from the media; here's one from the New York Times. If you enjoyed this, please consider liking and sharing.
------------------------------------------------------------------
I am a PhD student at Glasgow University. My PhD is in the application of Machine Learning for offshore wind turbines. More specifically, I am researching the convergence of ML, Digital Twins, and floating wind turbines. If you have access to resources which you think might be useful (e.g. datasets, contacts to FOWT designers/operators/developers, wind industry contacts who practice Digital Twins), I would be more than appreciative if you got in touch.
Follow on Twitter.
Appendix
Union Mill, Cranbrook: This article has been made possible by Peter Bourne of the Cranbrook Windmill Association. The website for Union Mill can be found here. Usually, you can visit UM in Cranbrook, Kent, but they are currently closed for a major restoration (reopening in April 2021). I highly recommend visiting their website in the meantime.
Notes
I. People more experienced with wind regimes will note that the log-law only really applies to steady wind regimes, i.e. the daytime. I am going to fudge this and apply it across all times of day. As for roughness, I will be using a single value as opposed to a rougness map for the likes of WAsP. I don’t have access to WAsP, and even if I did, I don’t think I’d go to the hassle of using it for such a back-of-the-envelope calculation.
II. This is another fudge. I should have calculated power across the full rotor disk but simply using hub height saved me a lot of time.
III. Why not use Global Wind Atlas? I tried, but the output files would never work!
IV. Capacity factor is the amount of power a WT produces in a year divided by the amount of power it would produce in a year if it was constantly running at its maximum capacity. A CF of 0.48 is maybe a little on the high side, but still reasonable.
V. This is just suggested text. I take no responsibility for the results of being this pedantic.
References
[1] DTU 10MW reference turbine: https://www.hawc2.dk/Download/HAWC2-Model/DTU-10-MW-Reference-Wind-Turbine
[2] Union Mill, circa 1930s: http://www.unionmill.org.uk/Images/History/Mill%20ca1930.jpg
[3] Union Mill dimensions: https://en.wikipedia.org/wiki/Union_Mill,_Cranbrook
[4] DTU WT specs: https://www.nrel.gov/wind/assets/pdfs/session_8_zahle_aero_elastic_optimization_10_mw_wind_turbine.pdf
[5] Wind profile equation: http://www.met.reading.ac.uk/~marc/it/wind/interp/log_prof/
[6] Wind data source: https://power.larc.nasa.gov/data-access-viewer/
[7] Union Mill: http://www.unionmill.org.uk/
[8] IEC wind classes: https://www.lmwindpower.com/en/stories-and-press/stories/learn-about-wind/what-is-a-wind-class
[9] Generic 3.45 MW - IEC Class 3: https://globalwindatlas.info/
[10] Flour consumption in the UK: https://www.ukflourmillers.org/statistics
[11] Steam-powered mill, Albion Mills, built in 1786: https://en.wikipedia.org/wiki/Albion_Mills,_Southwark
[12] Alibaba industrial mill: https://www.alibaba.com/product-detail/China-Hongdefa-Industrial-Wheat-Flour-Mill_60747281213.html?spm=a2700.7724857.topad_classic.d_title.72035b33ujXjC9