Dissecting the Joke
A Quite Interesting Analysis of the TV show "QI"
February 2021
Who's the funniest regular guest on QI? Who's the least funny? Can I prove it by putting good technology to bad use?
These are the questions which keep people like me up at night. That kind of person who has far too much time on their hands due to being in Tier 4. In the dead of winter. Whilst their partner is effectively stuck in another country. And needs some background noise whilst eating their solitary lunch.
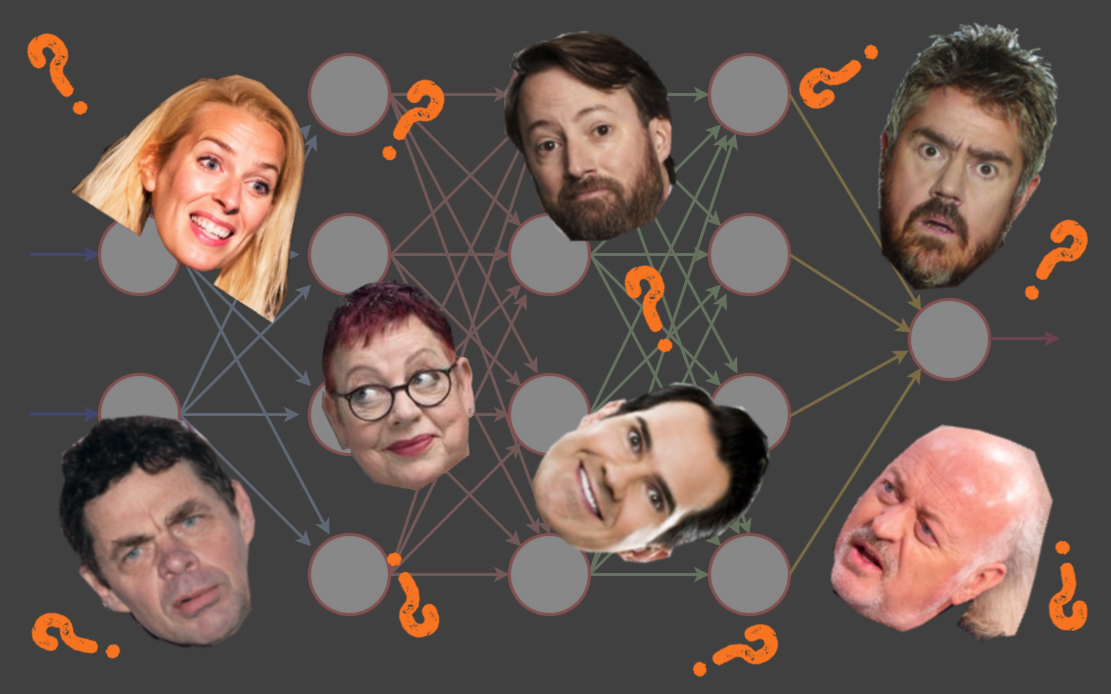
In this post, I use an Artificial Neural Network approach to determine the funniest, and least funny, regular panelist on QI. If you are unaware what Artificial Neural Networks are, then hopefully this piece will shed some light on them. Part of the broader category of Artificial Inteligence, they are a fascinating and powerful tool for tackling all kinds of problems and have exploded in popularity in the last 10 years.
QI
For those who are not aware, QI is a comedy panel show which has run on the BBC since 2003. At the time of writing there have been 18 series totaling 263 episodes. Stephen Fry hosted the show until Sandi Toksvig took over at series 14. The show pits 4 panelists against each other to answer the host's questions and to be "quite interesting". These panelists are made up of the ever-present Alan Davies and 3 guest panelists.

Regular panelist Alan Davies with current host Sandi Toksvig. Image provided by QI.com.
The Set Up
Over 180 guest panelists have appeared on the show, so how do we work out who’s the funniest?
The method used here is to feed data about the episodes (which guests, who hosted, and what series) along with a suitable metric for funniness into an Artificial Neural Network. ANNs work a bit like a brain and they will pick up on patterns in the data (a more in-depth introduction will come later on).
Once we’re confident that our ANN knows the patterns (via testing), we can then ask it to make predictions on fabricated scenarios. Using fabricated scenarios allows us to level the playing field between our panelists and so determine who truly is the funniest.
The Data
Data for the guests, host, and series number are taken from Wikipedia. Unfortunately, I could find no direct metric for "funniness". Instead, IMDb ratings are used. These were scraped and plotted below. An interactive version can be found by clicking on the image.
There are a few issues with using IMDb scores. First and foremost, IMDb scores do not directly indicate funniness. However, as the show is billed as a comedy panel show, comedy will factor into an episode’s rating. More discussion about using IMDb ratings is included in the footnotes, here.
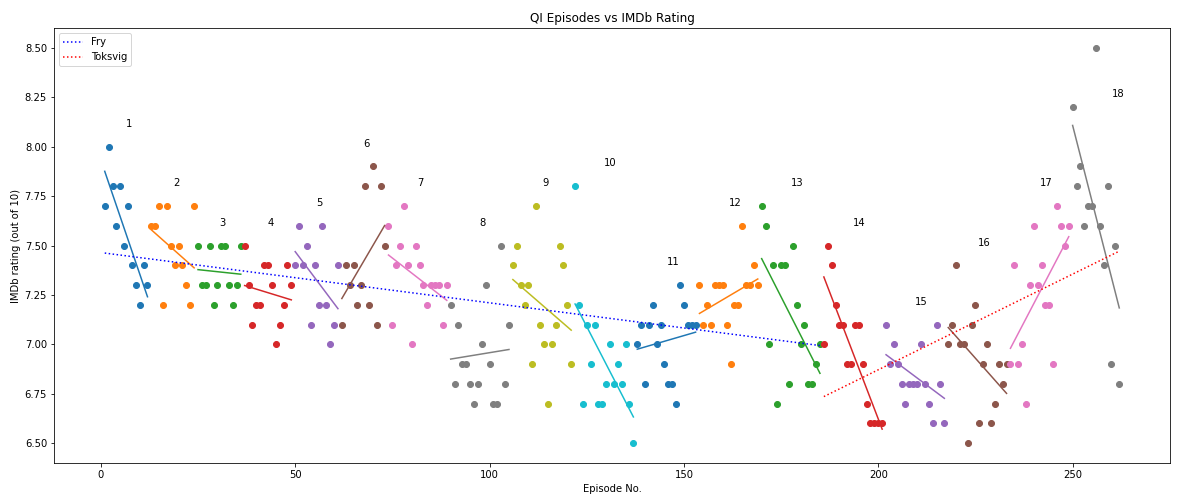
Click the image to be taken to an interacive version. Not recommended on mobile.
Only the most regular of panelists are included as we need a reasonable number of instances (i.e. episodes) to get reliable predictions of a panelist’s funniness. Generally, if you have too many variables (i.e. panelists) compared to instances an ANN, or any other method, can’t reliably determine how the variables interact with one another.
Determining the number of appearances required for a panelist to be considered a “regular” and be carried forward in the analysis is a balancing act: set the limit too high and you make the list too short to be interesting, set the limit too low and you’ll get questionable results. A good threshold appears to be 12 appearances or more. This leaves us 20 panelists and works out as the c. 80th percentile of multi-appearance panelists.
Unfortunately, this means we've dropped some big names and possible condtenders, such as Sarah Millican, Susan Calman, Noel Fielding, and Andy Hamilton. Most tragically of all, we have to say goodbye to ASIMO, the Honda humanoid robot, whose single appearance does not meet the threshold. Our remaining panelists are:
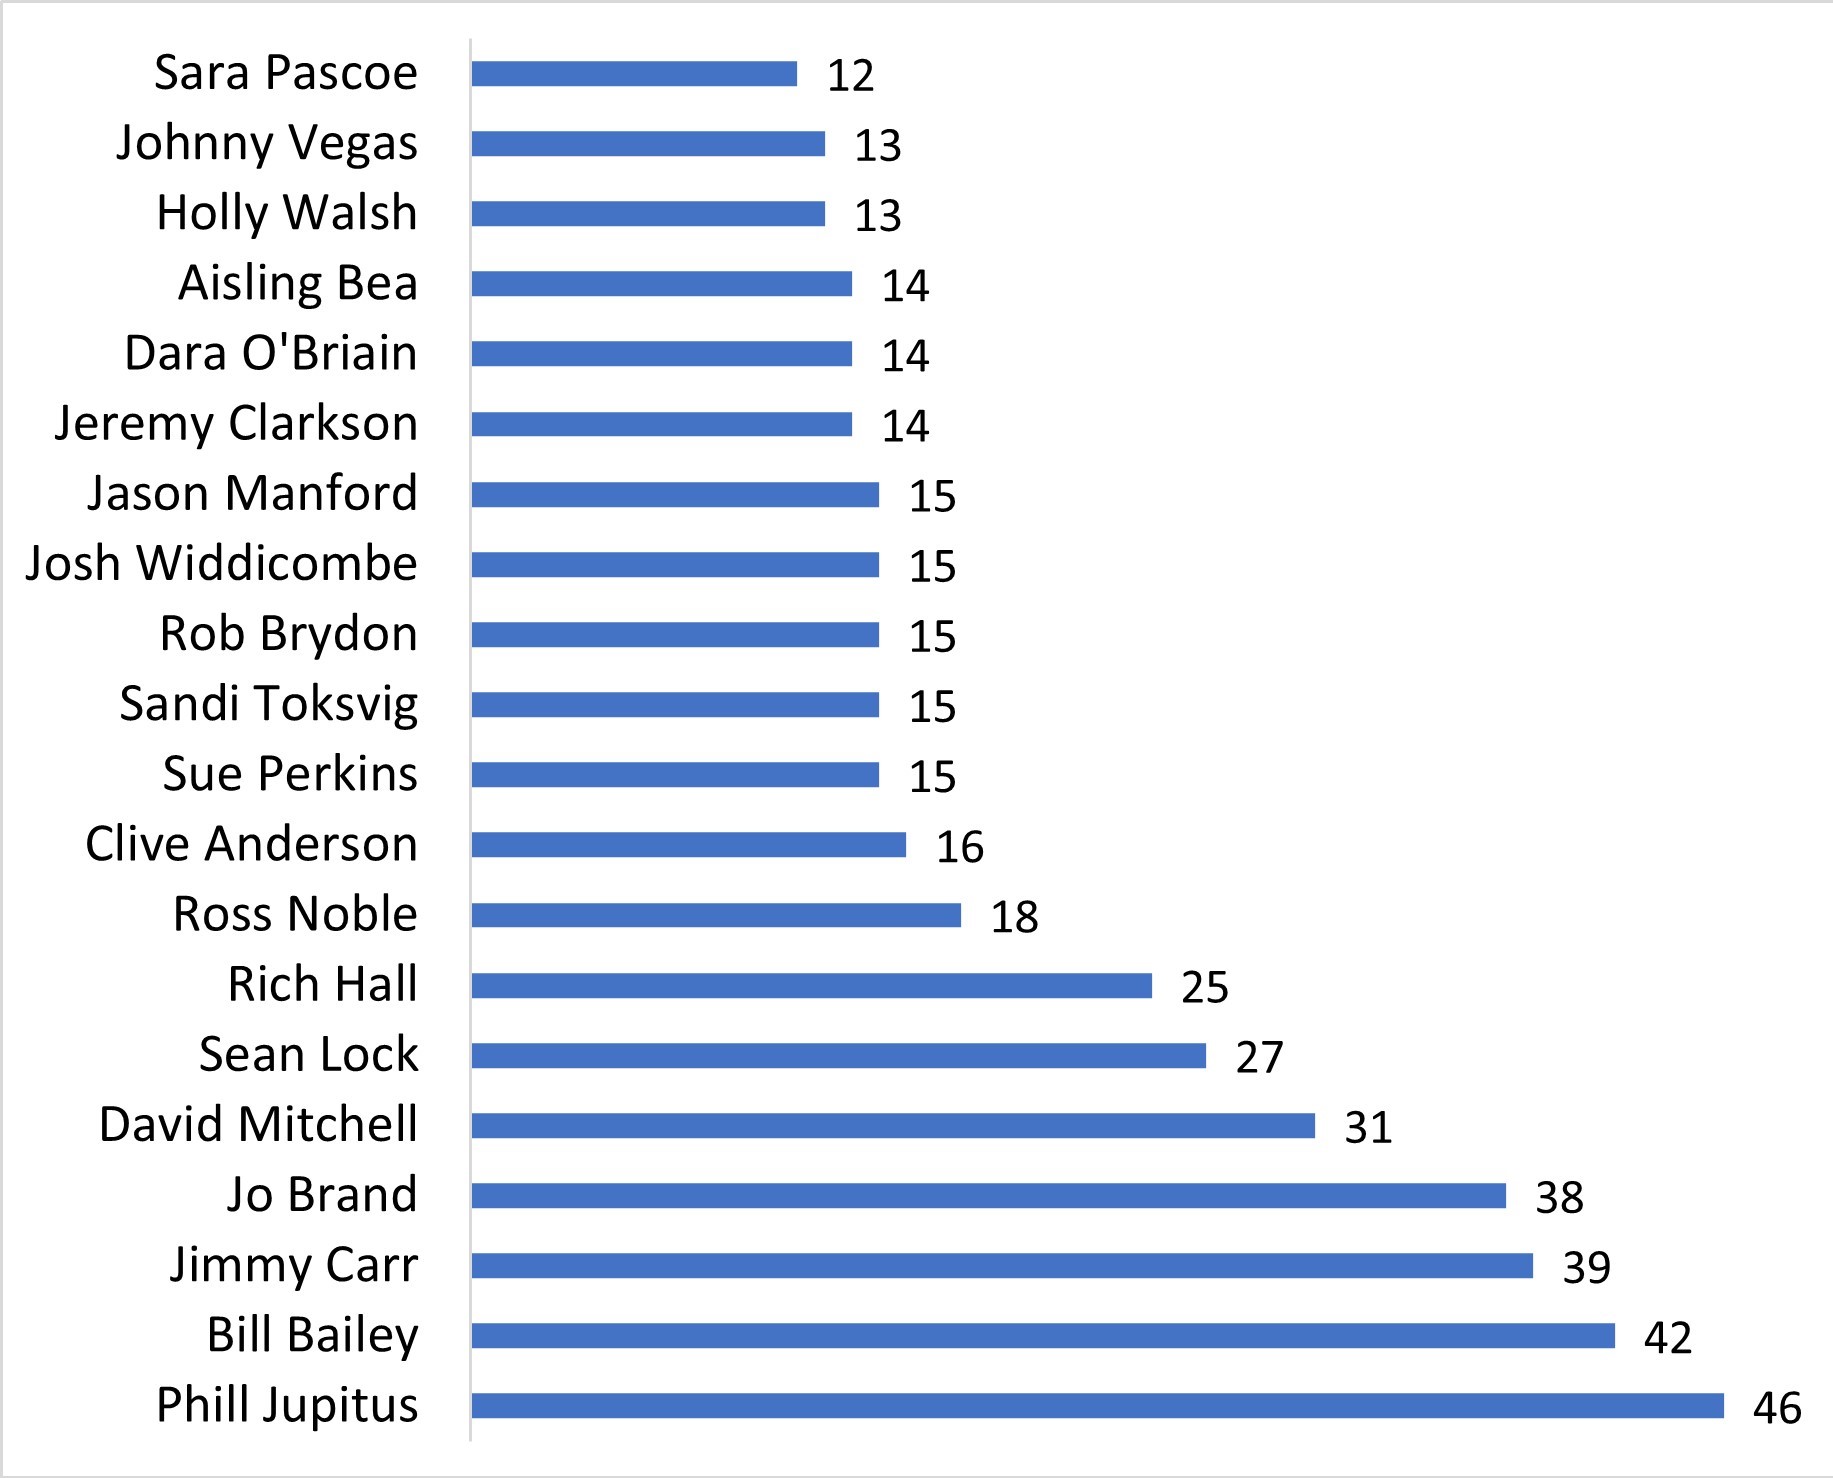
Number of appearances of each "regular".
Amazingly, 235 of the 261 episodes considered contained at least one of these regulars. Put another way, there’s only a 1 in 10 chance that an episode won’t contain at least one of this bunch.
Q: Why is Sandi Toksvig included but not Stephen Fry? Answer: We are only analyzing the panelists, and Toksvig made 15 appearances as a panelist whilst Fry was host.
Q: Where’s Alan Davies? Answer: Given that he appears in every episode, we won’t be able to determine how the show would fair without him, hence he’s dropped.
That wraps up the data, we can now go on to use it in the ANN. Next, I’ll give a brief beginners guide to ANNs. Alternatively, you can skip to the results by clicking here.
Artificial Neural Networks
What are Artificial Neural Networks and why use one here?
5 Minute Intro to Artificial Neural Networks
Artificial Neural Networks are mathematical constructs which are inspired by, and operate in a similar way to, the brain. Just like a brain, ANNs don't need to be explicitly programmed, they learn by experience using "training data". Once sufficiently clever, they can start making predictions.
As the name suggets, ANNs are networks consisting of "neurons". These neurons are aranged into layers. There are connections between neurons in adjacent layers, and each connection has a "weight" assigned to it. An example architecture is shown in the figure below. Note that there is 1 "input" neuron per input variable and 1 "output" neuron per output. For example, we might have a heating system which has 2 inputs, temperature and humidity, therefore it will have 2 input neurons. The output might be simply whether to turn the heating on or off, so a 1 or a 0. This means we only have 1 output neuron. The layers in between are known as "hidden" layers. These vary in layer count (depth) and neurons per layer (width) depending on the application. Between 1 and 6 hidden layers would do for most applications. More complex applications, like the guidance on a self-driving car, would have far more and be considered “deep” neural networks. This is where the term “deep learning” comes from.
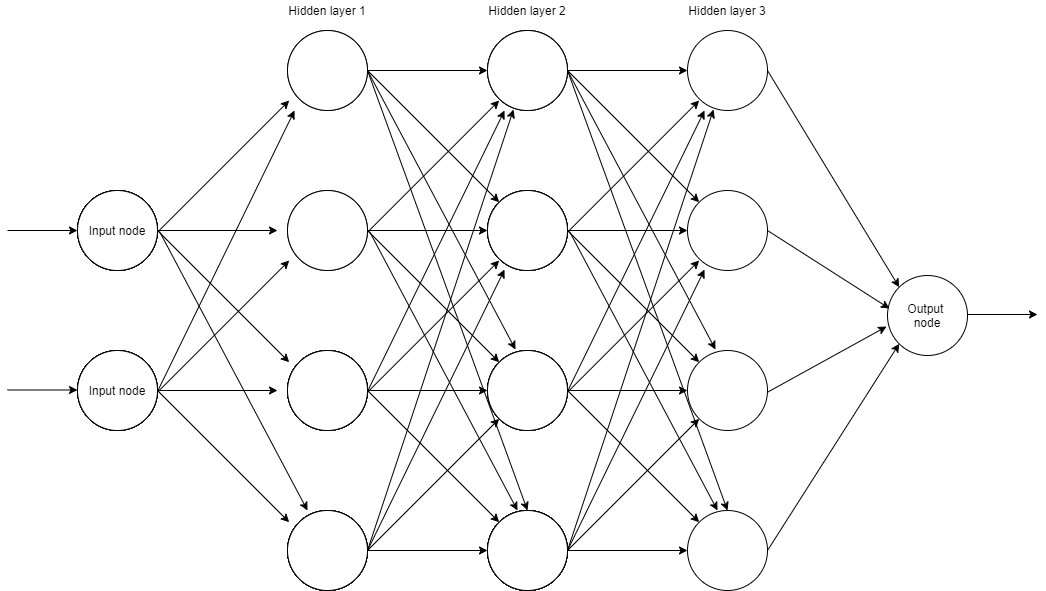
Example diagram of an Artificial Neural Network.
So what happens between the input and output layers? When data enters at the "input" layer it is immediately passed to the neurons in the first hidden layer via the connections. With reference to the diagram below, a neuron in the first hidden layer will calculate z, the sum of the product of inputs and weights (see the equation!). Z is then passed into the "activation function" which tells the neuron what value to output. The same output value is passed along every connection it has to neurons in the next hidden layer.
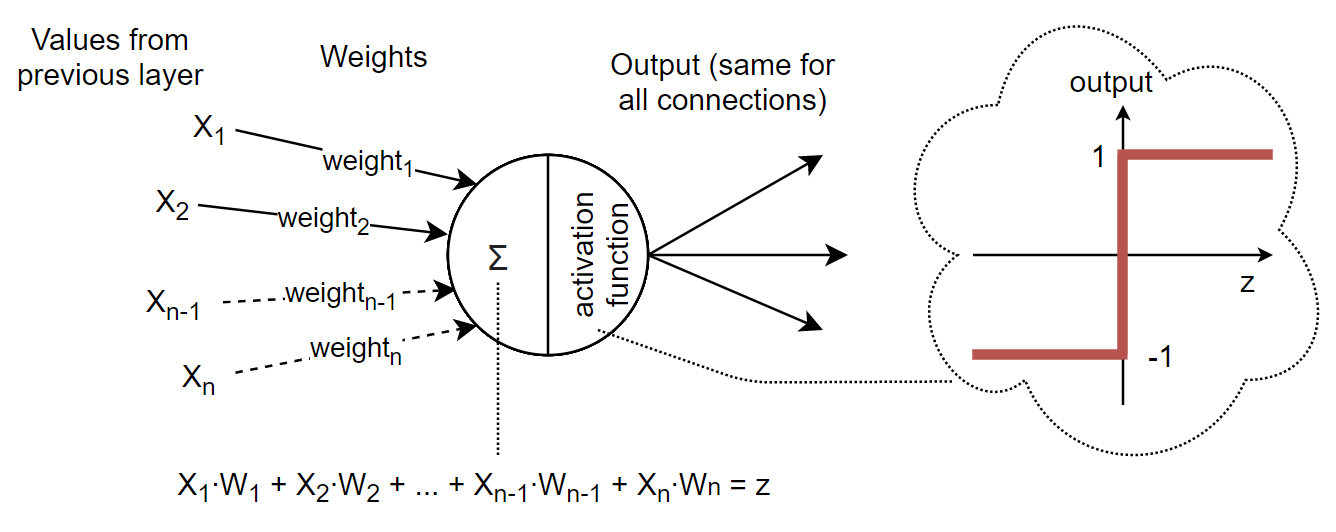
Diagram of a single neuron.
Note that this process happens for every neuron in a layer at the same time. So the calculations propagate layer by layer until we arrive at the output neuron. The output neuron is slightly different as it's activation function depends on the use of the ANN. For the previous heating example, we would choose an activation function which gives out only 1s and 0s. If we wanted it to give out an ideal temperature then we might remove the activation function altogether so it can output a range of values.
Training: When an ANN is training (i.e. learning) it is using training data to tweak all the weights so that its predicted output closely resembles the real value.
Initially, all the weights are assigned at random. It then takes a batch of data, runs it through, and compares its predictions (based on its current weights) against the real values. Using the chain rule it works backwards over the steps in the calculation to determine which weights to change to try to get better results next time (this is the Chain Rule). Once these tweaks are made, it then takes the next batch of data, and repeats. It repeats this process hundreds of times until there aren't any more tweaks to be made.
To reiterate, this is the crux of ANNs. At no point did we explicitly tell the ANN how we think the modelled system works, it worked out the patterns on its own. This is where the analogy of the human brain is clear. As babies, we pick up language by trial, error, and lots and lots of training data (special mention to all the patient parents out there). And, many years later, when a foreign speaker asks us an intricate question about our language, our minds blank and we respond “dunno why, just the way it is”, or at least I do. As children we did not explicitly learn these rules (for the most part), we learned and corrected for them as we went along.
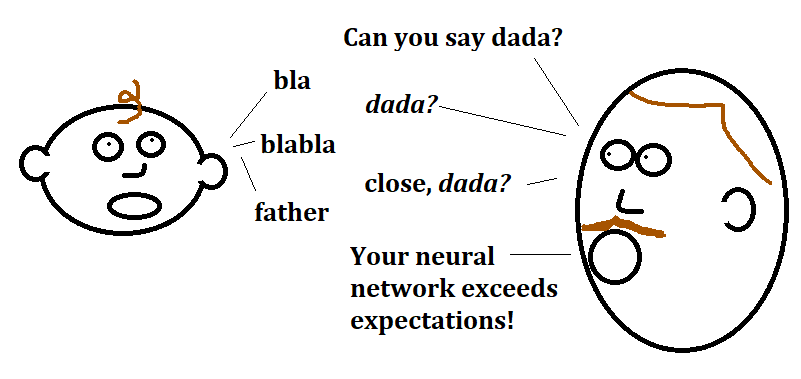
Illustration of the biological neural network training process.
This lack of explicit programming makes ANNs extremely powerful. If a problem becomes unwieldy due to its complexity, scale, or both, we can approach them with ANNs instead. Difficult problems like handwriting recognition, speech recognition, language translations, and weather predictions can now be tackled with a fraction of the lines of code compared to previous methods.
Before leaving this section, I made a few concessions on the description of ANNs for the sake of a simple explanation. First, the configuration of ANNs can vary wildly. Networks can split and rejoin, the numbers of nodes in a layer can vary, a node could feed backwards or skip layers forward, and nodes do not have to be connected to every node in the next layer. As for activation functions, it is rarely as simple as the step function shown in the diagram. There are a range of activation functions which change the output of that node. Studying the structure and influence of these parameters is an extremely active area of research.
Why use an ANN here?
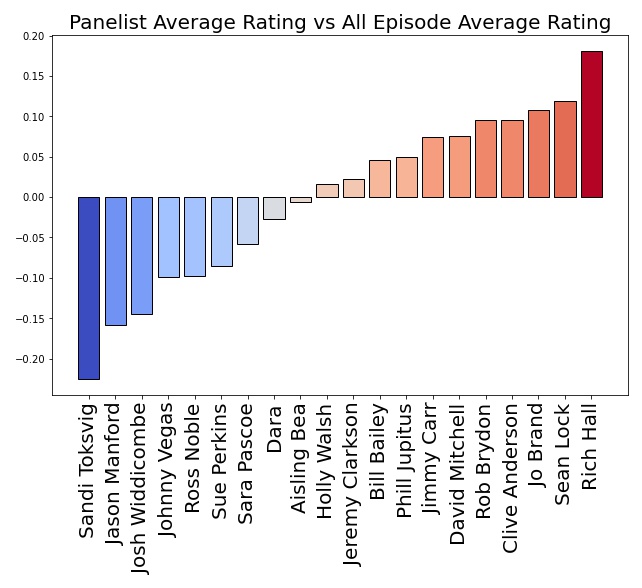
Why use an ANN when there are other suitable ways we can average every guests IMDb rating? For example, we could take the average rating of every episode a guest appears in, as I've plotted below. Other methods could be used such as logistic regression or statistical test such as ANOVA.
Yes, there are other approaches available which could capture the complexity of the system. However, using ANNs gives us the advantage of being able to make predictions. This opens up the possibility of simulating new scenarios rather than relying only on what has already happened. We can even go as far as finding the optimal scenario.
The most important reason to use an ANN here is that it makes for a quite interesting analysis.
The QI Artificial Neural Network
With ANNs, you have to try many shapes and sizes (i.e. layers and neurons) as well as different activation functions and many other hyperparameters. This is referred to as "optimization".
The QI ANN, after optimization, had only one hidden-layer, which was 35 neurons wide. It is therefore a shallow ANN, but this corresponds well to the literature. A shallow network is preffered when you have noisy or limited data. Why this is can be read in the footnotes here.
The Punchline
After all this reading, we can now see who comes out on top. Drum roll please…
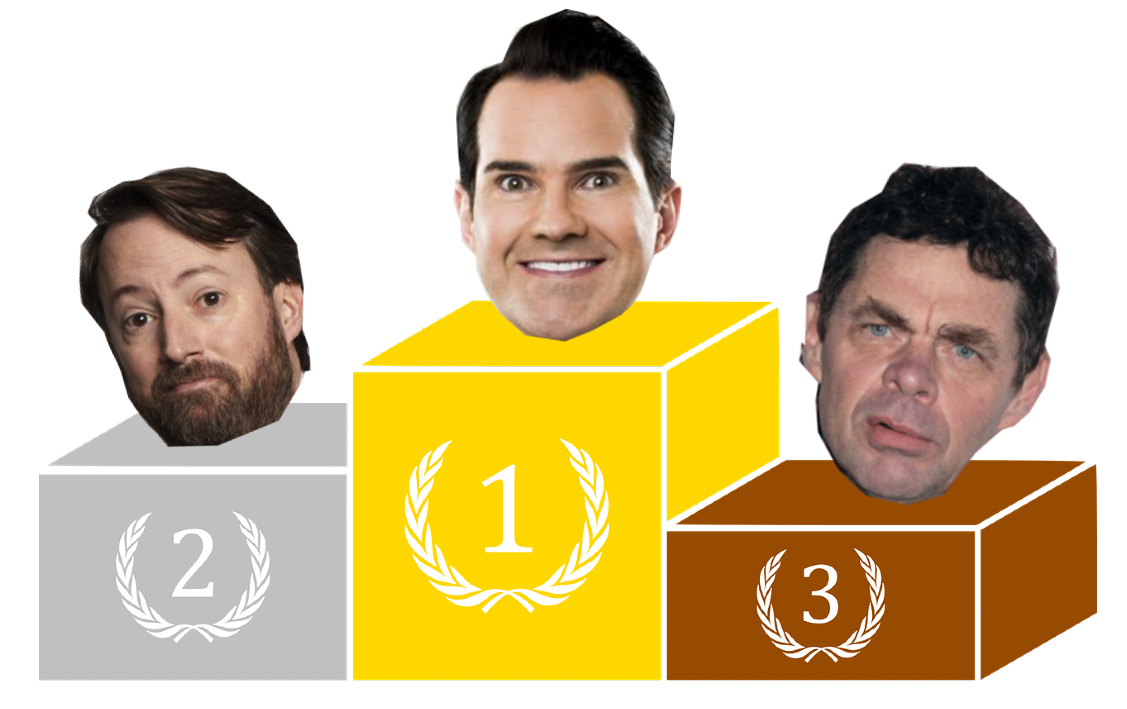
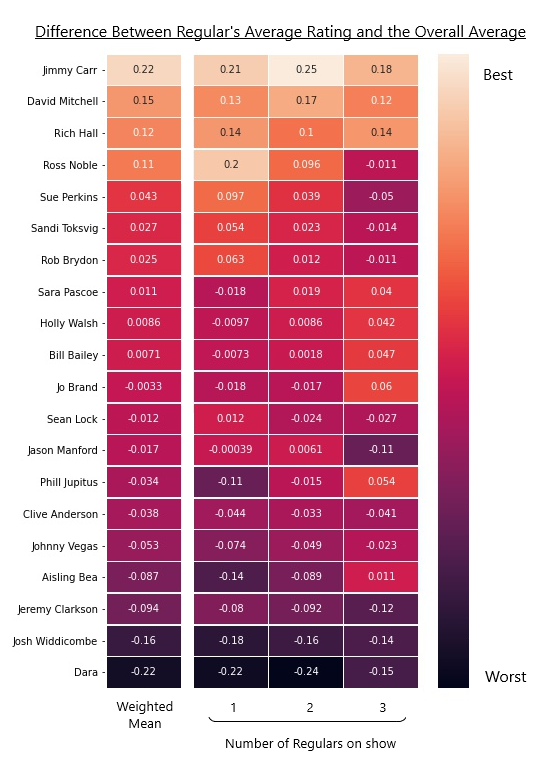
Jimmy Carr tops the podium! The man who makes us all laugh, but one which we never want to hear. Not far behind is David Mitchell followed by Rich Hall in third.
The final ranks have been determined using a weighted mean calculation based on the different scenarios of numbers of regulars (i.e. a show might have 1, 2, or 3 regulars appearing). More info in the footnotes here.
The full results are shown in the heatmap below.
ANN predictions results.
To explain the above heatmap a little more, all the values are given as the differences between that row's regular and the overall mean for a given scenario. Every column adds up to zero. The "Number of Regulars on show" refers to the different scenarios. Take the rightmost column, here we consider only shows in which we simulated 3 regulars appearing, we then calculate the average rating for all of those episodes a regular appeared in, then subtract the average value for all episodes in which 3 regulars appear. We do the same for 1 and 2 regulars scenarios. These values are then used, with weightings, to calculate the "mean" (leftmost column), as described in the footnotes.
Looking at the heatmap, not only are Carr, Mitchell, and Hall the top three, they also appear to be super panelists. These three appear to be above average under any scenario.
On the other end, the least funny of the regulars are Dara O’Briain, Josh Widdicombe, and Jeremy Clarkson.
Given that we simulated every conceivable combination of regulars/hosts, we can also look at the best combinations according to our ANN. The top 10 are shown below. Note that “Series” has been removed, otherwise the same combination pops up under different series.
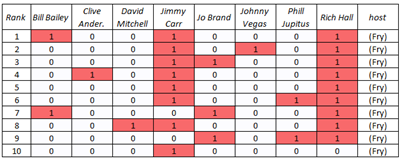
Best ANN-predicted combinations.
Conclusion
So, there we have it, Jimmy Carr is the King of QI.
I hope this post informed you a bit about Artificial Neural Networks and how they can be applied. I also hope the comedian you like faired well in the results. If you haven’t watched QI, I would recommend it for some laughs and some learning, both of which are sorely needed in these times.
If you have questions, comments, or ideas for another way to abuse good technology please let me know via whatever platform you found this post on. Unless it’s about doing the exact same analysis on another TV show (I’m DONE with that for now, time to move on).
All that’s left to say is goodbye in typical QI fashion. It’s a goodbye from my ANN and goodbye from me. I leave you with a quote from Steven Wright, who says, "You can't have everything. After all, where would you put it?" Good night.
Rory Morrison is a PhD student at Glasgow University. His PhD is in the application of Machine Learning for offshore wind turbines. More specifically, he is researching the use of ML in the modelling of floating wind turbines.
Rory is a Python aficionado (see other posts) and is open to collaboration and/or consulting.
A special thanks goes to Rory's brother, Callum Morrison, for reading through the draft of this post. Callum is a web developer and has promised to revamp THIS website in the future. His snazzy website can be found here, callum-morrison.com.
Further thanks to Charlie Egan and Duncan MacKenzie for their fabulous input.
Footnotes
IMDb Rating Discussion
Aside from comedy, the other major factor affecting score, one would assume, is the quality of the host’s questions for that episode. As a viewer of the show, I would say that the question quality is approximately the same from episode to episode, whilst the comedy varies greatly as a result of the different guests.
The second issue with IMDb ratings is that they are user-generated. They are not the product of some sort of comedy committee, anyone with an IMDb account can submit a rating so the quality of these rating is questionable. More can be read in this WIRED article.
Finally, it is likely that there are far more factors influencing an episode’s rating than just the raw comedy/question quality discussed earlier. For example, look at the change in ratings trend after the host change. I am certainly no TV producer, television student, or phycologist, but I would guess the initial decline is due to the format going stale, and then being revitalized with the host change. Or perhaps other factors are at play. Maybe the trends are due to changing perceptions of male-dominated TV shows? QI was criticized for lack of female guests in the early series. Maybe the caliber of the guests declined due to the show no longer being “hot”? Maybe rival shows emerged, or target demographics changed, or repeats on Dave caused QI overload? I am out of my depth answering such questions, in the words of Temple Grandin: “Engineering is easy – it’s the people problems that are hard.”
A final few notes about the data:
- Only standard episodes were considered. This means the specials (Comic Relief and Sports Relief), compilations, and extended episodes were not included.
- The cast of guests for each episode was separated out to separate columns. This was a necessary step in making the raw data understandable to any model. I have made the completed database available for download here.
- A quick check for outliers (based on z-score) resulted in 2 episodes with extreme ratings being removed (both in series 18).
QI ANN Discussion
The neural network was build using TensorFlow, a package developed by the Google Brain team. Following normal procedure, I used 80% of all the data to train and optimize the ANN, done so using TensorFlow’s functionality. A further portion of the training data was separated off as "validation" data. Optimization was reasonably painless to do, which highlights not only the quality of TensorFlow, but also how accessible Machine Learning has become in recent years. Note that TensorFlow is completely free to use, and that I was running it on Google Colab, which is also free. Given that Google Colab lets you use their CPUs/GPUs/TPUs to do the computations, this negates the need to own a powerful laptop so further lowering the barrier to entry.
The QI ANN ended up being 3 layers thick:
- Input layer: 22 input nodes, 1 for each input variable. These are “series”, “host” (Fry or Toksvig), and 20 corresponding to the 20 regulars.
- Hidden layer: 35 neurons thick.
- Output layer: A single output node which gives the IMDb rating prediction.
This "shallow" network corresponds to the literature as you tend to want small numbers of layers when the training data is both limited and noisy. This avoids overfitting the training data. Overfitting is when an ANN has tuned itself to fit the training data so tightly that when new and unseen data comes in it performs poorly. The opposite is underfitting, when an ANN has tuned itself so conservatively that it fails to pick up on patterns in the data in any meaningful way.
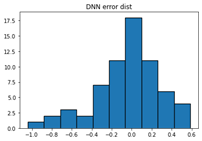
The prediction error for the 20% of data we held back to test how accurate the ANN is is plotted below. Promisingly, it appears centered around 0, but looks slightly tailed towards the negative side.
The Pearson correlation, which was applied before, can be applied again between ANN predicted rating and the true IMDb rating. This produces a value of +0.364171. This may seem low (a maximum score would be +1.0), however, it is more than double that of any correlation with IMDb rating found in the raw dataset (which included all regulars, Series, Host, and the number of regulars appearing on an episode). For such little and noisy data, the ANN has done surprisingly well at picking up the patterns.
Histogram of ANN prediction error.
Mean Weighting Discussion
To explain this, first have a look at the heatmap where you can see that there are columns corresponding to average predicted score for each scenario. Instead of averaging these 3 results to get the mean, we can apply a weighting to each scenario depending on how often it is to appear in the real dataset.
Out of the 261 episodes considered in the original data, there have been 80, 111, and 44 episodes with 1, 2, and 3 regulars appearing respectively.